article thumbnail

MIT Site Plans and Diagrams

Visualizing Architecture

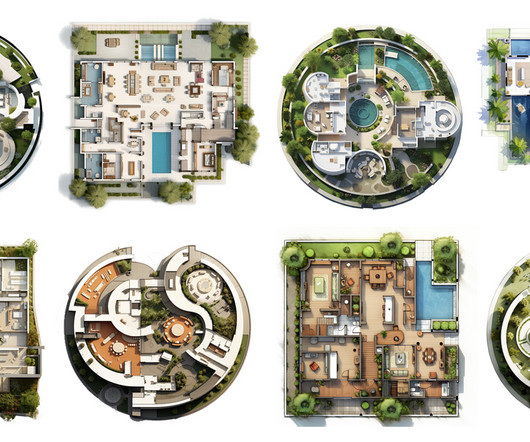
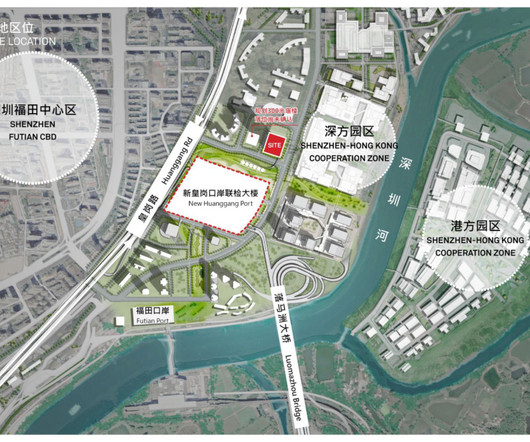
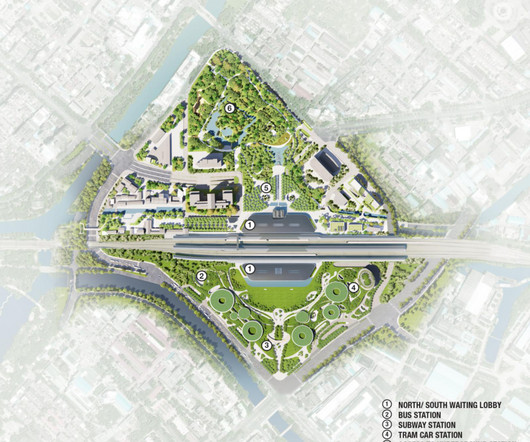
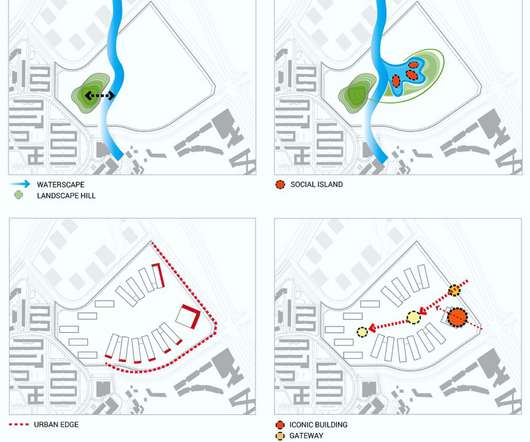
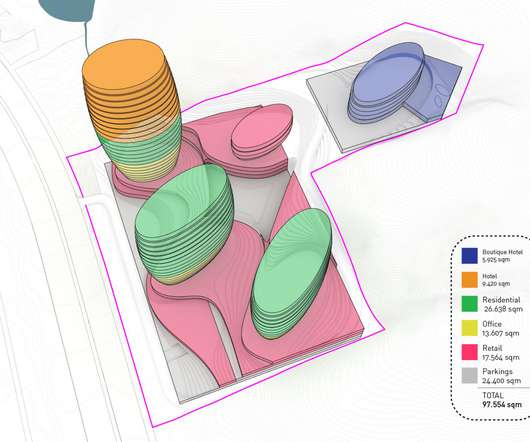
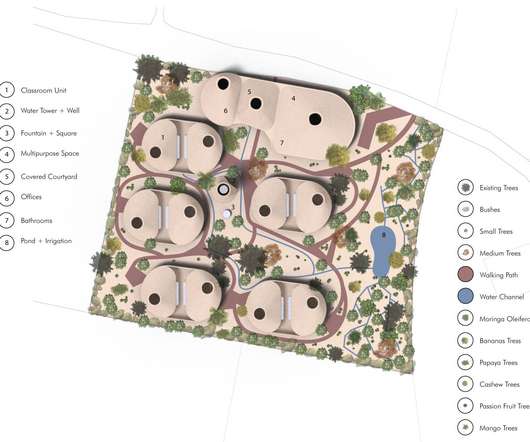
I also generated a before and after semi-photoreal illustration of the site plan. Plus, I like the visual contrast of the abstract diagrams next to the realistic illustrations of the site. Sometimes, especially with diagrams, shadows can be distracting and impact clarity so I wanted to have both options ready to go.

Diagram 52
article thumbnail

OMA's Harajuku Quest center performs an urban balancing act in Tokyo

Archinect

The 84,000-square-foot mixed-use scheme will contain commercial and cultural functions set within a building form shaped by two differing urban contexts that interact with the site. Concept diagram. Image credit: OMA Concept diagram. Concept diagram. Image credit: OMA Section diagram.

Diagram 328
Insiders

Sign Up for our Newsletter

This site is protected by reCAPTCHA and the Google Privacy Policy and Terms of Service apply.

Trending Sources

article thumbnail

MVRDV's first U.S. building creates a 'colorful vertical village' in upper Manhattan

Archinect

Image © Ossip van Duivenbode Image © Ossip van Duivenbode The 300 million-dollar mixed-use scheme is composed of a series of stacked blocks whose proportions were derived from the site’s surrounding buildings.

Diagram 334
article thumbnail

Flatiron by Works Progress Architecture (W.PA)

Archinect

The Portland Flatiron building is a timber framed mixed use building sited at the edge of a sloping triangular site in N Portland. In addition to the unique triangular configuration, the site also sits at a directional shift in the city grid of NE Portland.

Diagram 246
article thumbnail

Junya Ishigami 'excavates' concrete cave for restaurant and residence in Japan

Archinect

Photograph ©︎ YASHIRO PHOTO OFFICE Photograph ©︎ junya.ishigami+associates The scheme’s construction saw the site excavated to shape an inverse volume of the final design. Concrete was then poured in situ and the surrounding earth excavated further to reveal the final form.

Diagram 299
article thumbnail

These 8 Video Tutorials Will Help Take Your Axonometric Diagrams to the Next Level

Architizer

Here, the creator shows how to download a 3D model for a part of a city and turn it into an aesthetic plan that can be used to study the site density, add context or understand circulation. The post These 8 Video Tutorials Will Help Take Your Axonometric Diagrams to the Next Level appeared first on Journal. Complex Cutouts.

Diagram 76
article thumbnail

7 Top AI Tools for Generating Smart Architectural Plans

Architizer

The software uses site data such as topography, flood maps and building regulations as well as additional parameters set by architects, to generate layout options for a plethora of building typologies: multi-housing projects, retail stores, hotels, industrial sites and even parking lots.