
Matt Elliott writes a newsletter called the City Hall Watcher. And one of his features is something called Intersection Inspection. It is where he does a deep dive into traffic counts and modal splits for intersections across Toronto. This week, he covered Yonge & St. Clair in midtown, and so I thought it would be interesting to share it on the blog. (Thanks to Canada Record for the tag on X.)
Here are traffic counts for the intersection going back to 1984:
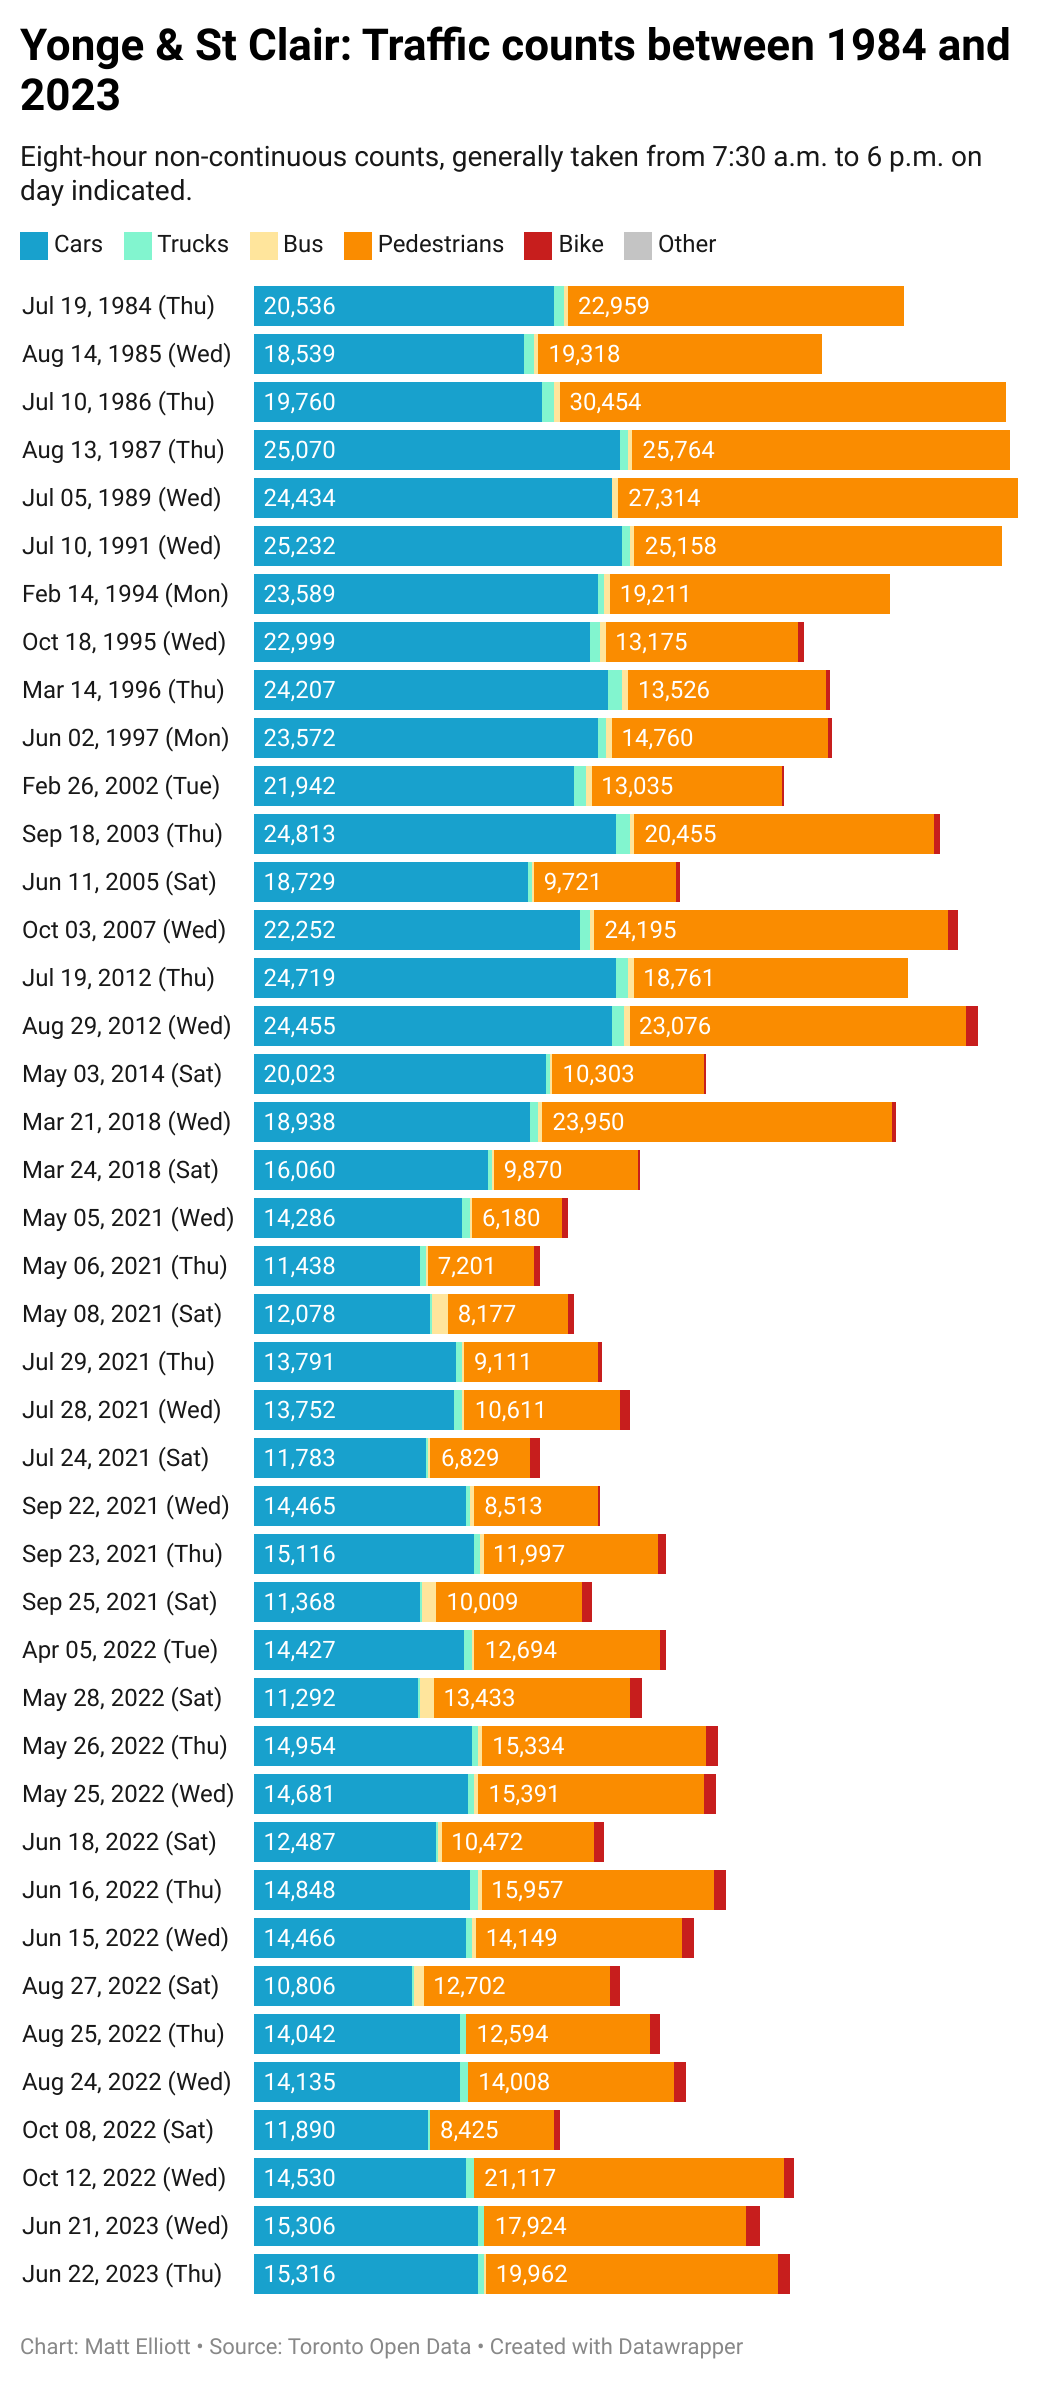
What seems clear is that Yonge & St. Clair is fairly evenly divided between cars and pedestrians. And it has been this way going back many decades. At the same time, though, the volume of cars seems to be declining. According to the above data, cars haven’t seen a count above 20,000 since 2014. There does also seem to be a slight spike in bike usage recently (this is broken out further in Matt’s newsletter).
Data is crucial to good city building and I don’t think it is leveraged nearly enough. For example, take the intersection of Baldwin St and Kensington Ave in Toronto’s Kensington Market. If you look at the traffic counts (which can also be found in the above newsletter), you’ll see that 88% of traffic tends to be from pedestrians (79%) and bikes (9%). Only 12% of traffic is from cars.
With this data in hand, you might, then, ask yourself: Should Kensington Market be mostly pedestrianized? And in my opinion, this is a lot easier to answer when you have numbers in front of you telling you how humans actually occupy the area.

This is a PERFECT example of how misleading and deliberately skewed stats can be. Those stats ignore the horrendous change on St. Clair – being the dysfunctional dedicated street car lane that has made moving on that street in any form of vehicle, a nightmare. Do ya think that might affect vehicle volume, in a rapidly densifying city????? Just sayin
LikeLike
On, ‘falling number of cars since 2014’ — this aligns with my posit (in 2016), that the network is ‘broken’ (too many cars at peak, average speed falls to 10km/h cars are designed for 50 km/h plus but they crawl along at 10 = broken system)
LikeLike
Isn’t this common all across the city?
LikeLike
which is EXACTLY the problem – “density” far surpassing infrastructure capacity- with the consequent diseconomies (11 Billion per year according to the latest from the Toronto Board of Trade) all in “aid” of “affordability” which is precisely the opposite of what density brings – not the mention the massive cost of even attempting to upgrade infrastruture in a built up urban area – in a virtually bankrupt city yet – the unremitting propaganda supporting this lunacy is a demonstration of subverting the common good for the sake of the Laurentians
LikeLike
I see the disconnect now; the falling numbers of cars counted isn’t falling demand – it’s falling capacity – (the factor of speed).
LikeLike